
I am participating in a workshop at University College Cork as part of the Digital Arts and Humanities PhD programme on Friday and Saturday this week. The agenda, covering aspects of data management, data encoding, space and time, data modeling, and network analysis, looks very exciting. It is all predicated on giving a quick overview in support of a hands-on hackfest working with the Frank O’Connor collections from the UCC special collections on Saturday.
As I was surveying the latest materials to update, extend and refine information I have presented in the past, I have collected a few tangential pieces that seemed worth noting.
Information Visualisation by Dr Katie Börner
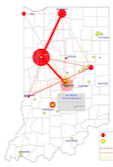 I have been casually following (i.e. I never find the time to spend participating actively) in a MOOC on Information Visualisation being delivered through the Indiana University at Bloomington. It is very broadly based with a scientific eye towards exploring, where, when, why and the associated tools and methodologies that can be employed to gain a great understanding of the data. In trawling, I found a very thoughtful paper published by Dr Börner ‘The Cartographies of Science‘ which uses social network analysis to explore information transfer and illustrate the results by exposing the methodology and the visualisation techniques used to deduce how scientists are working together and what they are working on. I like this paper as it offers some wonderful examples of how these same methods and techniques might be applied to historical or other humanities data to ask similar questions.