
In an earlier post, I pondered the occupational composition of the House of Commons and its implications on policy making. This post cast an historical gaze on the occupations of MPs at Confederation. It compared the occupational composition with the current and hypothesised about the evolution of this composition over the past 160 years.
As mentioned earlier, gut instinct was that lawyers were a more dominant force in earlier times possibly had a more decisive role in policy making today than earlier. This chart:
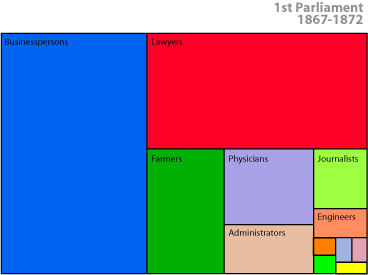
shows the occupational composition of the Canadian Parliament in 1867. When compared with the current composition:
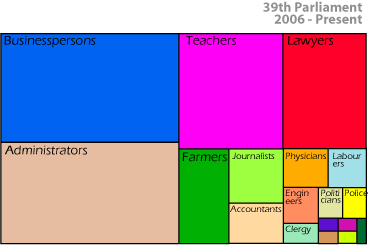
this anecdotal idea that businessman have risen in dominance is not supported. Although lawyers formed a much larger proportion of the house in 1867 than they presently do, it is in other areas that we have seen greater change. Business men and women continue to hold the largest proportion of seats. However, it is those self-identifying as administrators/professional civil servants that have assumed a greater role. The other significant change is the emergence of teachers as a profession.
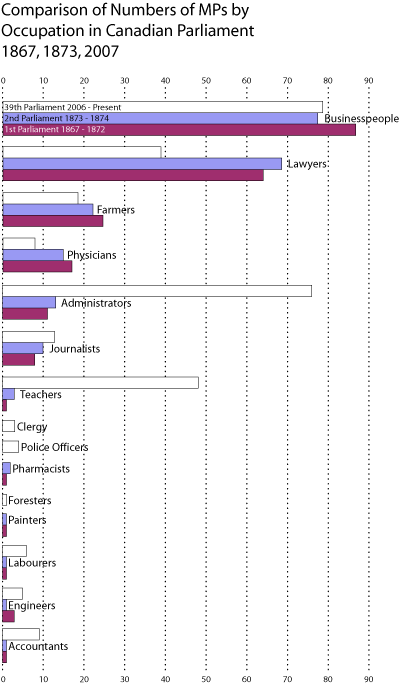
To gain a wider perspective, this bar chart compares the number of MPs for each occupation over three representative sessions of Canadian Parliament – the first two in the nineteenth century and the current session:
The next post will examine regionalism, party politics from an occupational perspective.
I used the tree chart tool from Many Eyes to create these visualisations. Alas it is no more 🙁