This study has been going on for a few years now. The technology used has evolved rapidly during this time and continues to do so. Originally, Abobe Illustrator was the primary rendering tool. More recently the ability to use SketchUp in conjunction with ArcGIS has allowed more rapidly modelling and the ability maintain a live link between the data and the representation.
Background
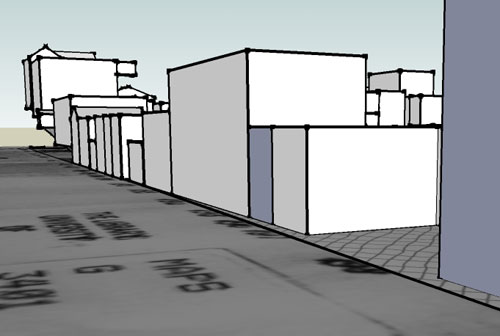
The intention of this study is to investigate ways in which demographic data can be represented spatially. A database has been created using manuscript census data, tax rolls, court records, and probate records. These have been manually matched across the spectrum from 1851-1911. This database has been combined with maps of Guelph created in ArcGIS. Taking advantage of the ArcGIS extension for SketchUp, these records are then shared with that program and presented.
This process allows an investigator to virtually walk down nineteenth century streets in Guelph, peer in windows and knock on doors to discover what is going on inside and who inhabits a particular place of business over this period.