
I like to express myself visually. Often this is more effective and comes more naturally to me than trying to express myself through words. Here are few examples of some of the materials that I have created over time to illustrate concepts, ideas or represent quantitative data. Maps are located elsewhere.
Social Network Analysis of Apple Taxonomy
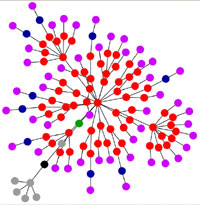 This remains embryonic. My mother and father have two orchards at Springmead that have a wonderfully diverse collection of species, both popular and some rather rare – but always tasty. You can find out more about the varieties themselves at the Springmead Apple webpage. To explore the taxonomy of the species themselves I use the program Pajek, which used for constructing social networks. I thought this might be an interesting way to visualize the way in whcih species are related to one another. The SNA diagram is displayed here.
1851 – 1911 Census Divisions for Essex County
When I was working with the manuscript census data from Essex County to compile a compact, focused dataset for exploration purposes, I realized that it would be helpful to create a visual diagram of the way in which census divisions subdivided over time.
Napoleonic Timeline
Way too much fun! There is a wonderful timelining tool available from SIMILE. It takes an XML file as a source and visually displays events and reference material in an interactive timeline. I recall creating an early version of an interactive timeline back in the late 1980s of the changing domains of the Hapsburg dynasty using Authorware. I wish I had a Flash version to show up to contrast the evolution of this technology. However, I digress. This timeline shows about 500 key events during the Napoleonic era. Give it a try.
1878 Mass Model of Guelph
These screen snaps demonstrate one of the bridging projects between my MA and PhD work. I have created a 3D representation of the Town/City of Guelph and connected the visual representations with a database of census data so that one can virtually walk the streets of the town, peer in windows and knock on doors to find out who inhabited the nineteenth century community.
MP Occupations 1867, 1871, 2007
This chart shows how the occupation that MPs self-identify themselves as coming from has changed over the past 130 years in Canada.