Mapping Vice and Ethnicity
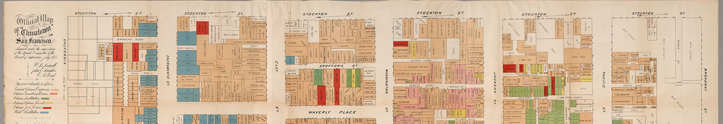
A very fine post by Susan Schulten at Mapping the Nation inspired me to cite it and comment briefly. Mapping vice in San Francisco pulls a selection of maps from the fabulous David Rumsey collection that illustrate the rise of political…