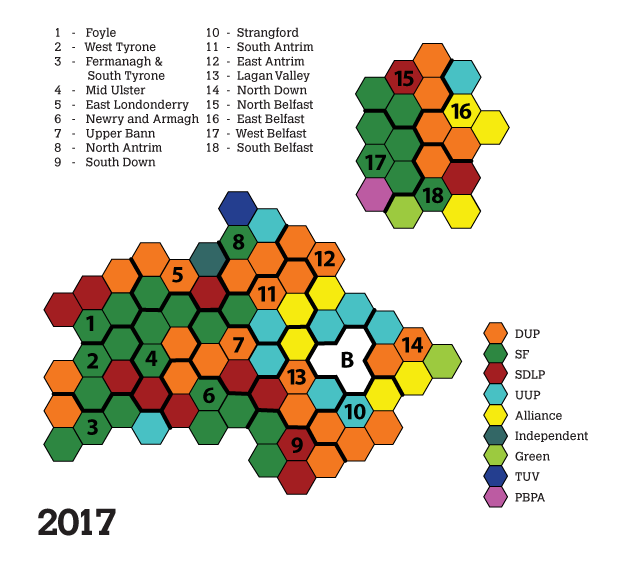
Continuing the trend of plotting the Northern Ireland Assembly results on a custom hex map of constituencies (with the new 5 seaters), the latest (unverified results) are available here:
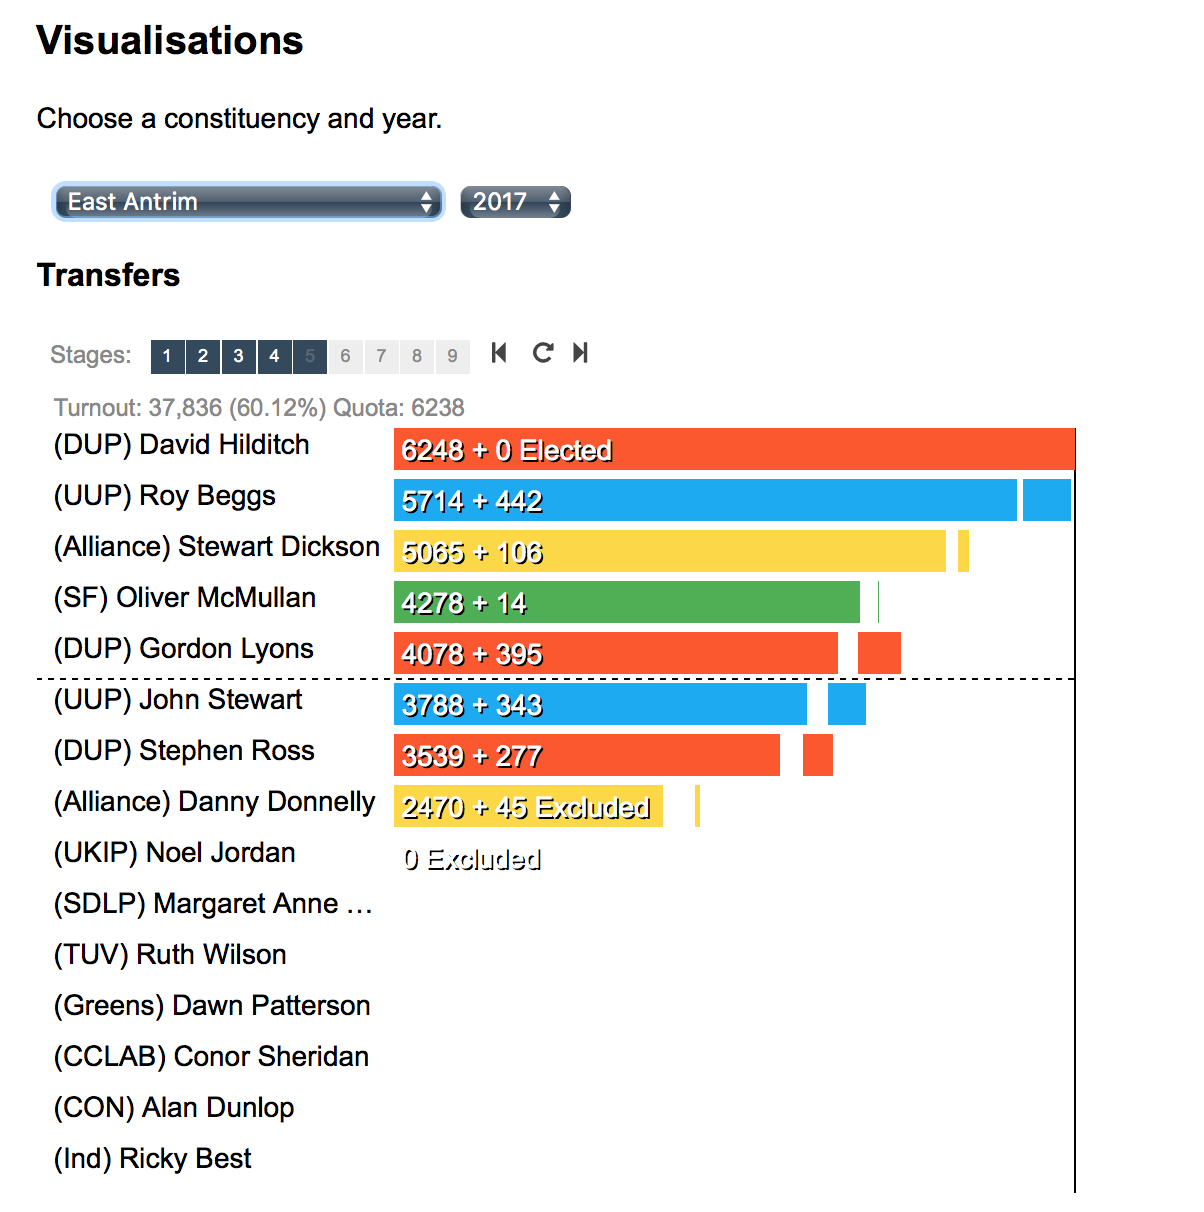
I remain somewhat skeptical about whether the spatial arrangement adds mush to the picture. The BBC uses a rather linear hex diagram which I am not sure provides any clarity – I do think the pseudo-spatial arrangement lends some additional relevance. Simple bar charts provide a very good indicator of the actual seat distribution without and spatial connection. The animated round-by-round, constituency-by-constituency demonstrates the actual counting process and comes closest to explaining the complexities of the STPV system:
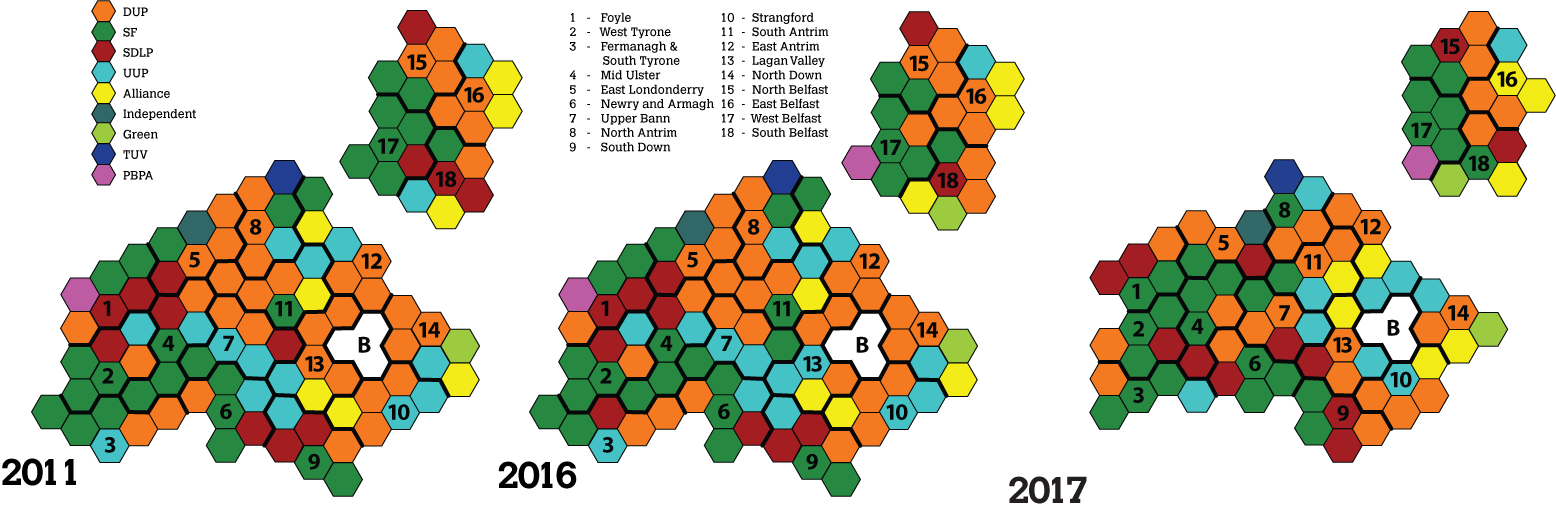
It’s a little tougher to do a direct hex-hex comparison between elections this go around with the reduction in seats. However, the following attempts to show patterns between 2011 – 2016 and now 2017 as best can (click for a larger image):