[Cross Posted from QUBDH]
 So what about those hexagons? They were all the rage during the UK General Election last year – the BBC actually constructed a physical jigsaw in their atrium out of them. At the time I mused on there usefulness for providing a pseudo-spatial representation of return data. At the time I was largely positive and have subsequently experimented with their usage in place of heat maps – as in the example below looking at healthcare coverage. On a popular basis they appear to have been a passing fancy with the major media organisations abandoning them just a year later during the UK local and regional elections. I haven’t abandoned them yet myself and found that for the NI election this week they offered a useful sense on the allocation of seats by constituency.
Carrying out another hands-on exercise with them has raised additional considerations in my mind about some of the implications for this form of visual representation. Adjacency is a large factor and construction has to be careful not to imply regional dominance or actual local placement within a constituency. The challenge with multi-set constituencies in the North of irelands well as the Republic is this complication that isn’t present in the more common single seat constituencies elsewhere.
When attempting to map hexagons onto a physical map containing constituency boundaries, there are a variety of compromises that have to be made and there is substantial danger of subjective interpretation of shape, volume and arrangement relative to the larger … The intent is to provide a degree of familiarity and identifiability of shape and proximity. There’s a as much art as science in this construction.
Colour is going to provide an additional complication and one that the data visualiser has to take into account.
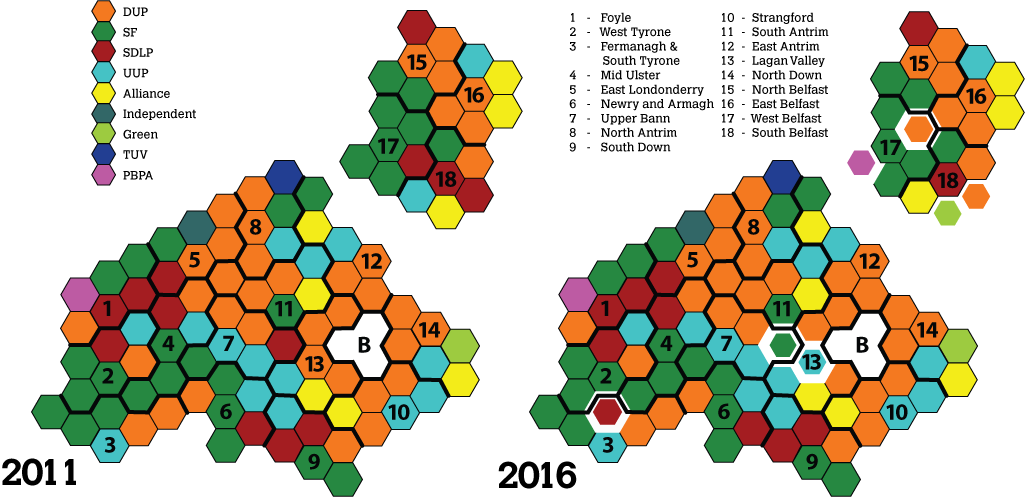
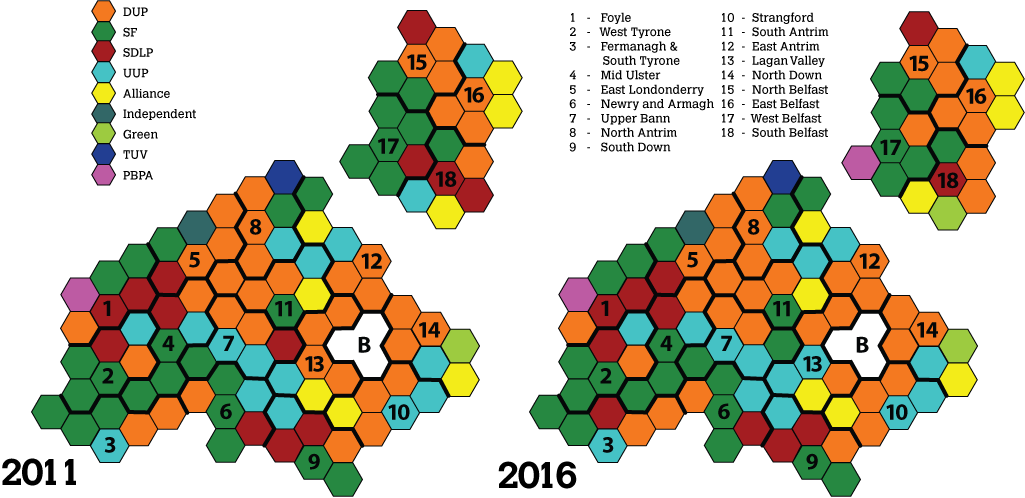
In the case of the sample visualisation provided herein, I have mapped seat distrqictution across a hex map of Northern Ireland for the results in 2011 and now for 2016. In constructing the base hex map I prioritised overall shape and had to make compromises due to hex density in constituencies where the area didn’t always accommodate the uniform hexagons being used. In fact it was both necessary and I think correct to extract Belfast from the larger map to make this an effective and useful visualisation.
Additionally when mapping the set allocation within a constituency the party seats were not allocated with any geographic intention – although I am aware that simply by putting them in a spatial context this will be implied. However, where possible I did make an attempt to establish some degree of contiguity across party hexes where this was possible – which tends to provide visual magnification of density. Arguably, I should possibly be attempting to avoid just that.
I think it is interesting in this usage to consider whether it provides any usefulness for comparison between elections. I fear it does not unless there is a massive change in distribution. As it is I made a visual choice to highlight changes (as subtly – bit still noticeably) in the 2016 results with white boundaries around seats that changed party affiliation. I am not quite pleased with this representation.
Nonetheless here for your viewing pleasure are the results of this exercise. It does provide some degree of indication of regional representation patterns in NI – although this will always be challenges by the MS constituency.
There’s much more to arranging the hexes than meets the eye – and must power, danger and consideration that clearly has to be undertaken. Will be quite interested in seeing what sort of feedback this experiment generates and what is really offered by the hexagon mapping of data.
2011 v 2016 Northern Ireland Assembly Election Results