I hadn’t been to the Digg Labs area in a while. Wow. They have a wonderful assortment of story 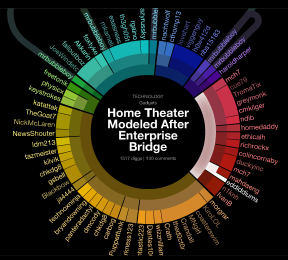 and author visualization tools available there that are both mesmerizing and thought provoking. Navel gazing is a wonderful past-time and methinks that Digg is making a concerted effort at perfecting the art. I am particularly attracted to the new Arc tool. Its shows story popularity in realtime and also makes a link between stories dugg by the same users. Thicker vectors indicate story popularity. Interesting.
The Stac visualization is also extremely cool. A collection of stories represented by bars of varyiong shades based on popularity spread across the bottom of the screen and then as they are dugg, weight blocks fall from above reinforcing the story title. Just neat. And as before far to mesmerizing.
Its a quick way to gauge popularity and user activity. The animation is smooth and entertaining. Popular of course has nothing to do with my interest or relevance, but the visualization is effective in conveying the info and it does make a fine screensaver. Apple’s new RSS visualizer in Leopard is another cool infofeed screensaver. Visually stunning.

There is something addictive about watching live visualization. It isn’t just the visualization so much as how it changes and matures that is intriguing. What might be the literary or historical research equivalent?
Compare this with Time’s latest national naval gazing, “One Day in America” http://www.time.com/time/2007/america_numbers/commuting.html
I suspect you’ll like the day vs nigh urban population maps and the happiness graph, but the commuting data turned out better in print and I’ve seen alcohol consumption better represented on this site!
@Josh: I do think the commuting data representation is quite unclear and was worried when I hit the site and that was the first one displayed. Then I saw the day/night population shift…that is very clear and well implemented. The happiness scale is just plain fun. I will have to see where that can go. Great reference. Thanks.
@Geoffrey: I think that there might be a very fun literary one and I will see what throwing computing power at it can deliver. As to historical … this is a very interesting view of time…changes the perception of chronology. The question, and the one I constantly have to ask myself, is will this visualization allow me to see that I otherwise might miss.